|
|
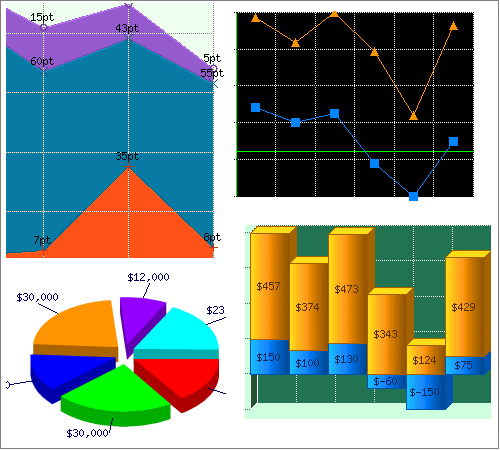
 | The Vertical Bar Graph API is a Java Bean Component. Designed specifically to enable programmers to easily add powerful graphing functionality to any form of Java application Download the Free Trial today for access to:- - Documentation - Code samples - Demo Applications - IDE specific instructions ...
|
 | Web Enabled solution for creating Stacked Horizontal Charts & Graphs. Versatile components for web authors and developers to easily build and publish dynamic and interactive bar graphs. Database Access Methods (Direct Data Binding and Multi-Tier) Template Scripts and Implementations (ASP, JSP, PHP a...
|
 | This applet is designed to take multiple series of numerical data and display the information as a 3D Multi series stacked Column Chart. The applet will automatically size itself to the available area given to it by the HTML form. (The WIDTH and HEIGHT of the APPLET tag.) General Features 3D Mode Ch...
|
 | This 2D / 3D Vertical Bar Graph provides both a client and server side solution for the incorporation of bar graphs into web pages. It provides versatile components so that web authors and Java developers can easily build and publish dynamic and interactive bar graphs. We have built in many configur...
|
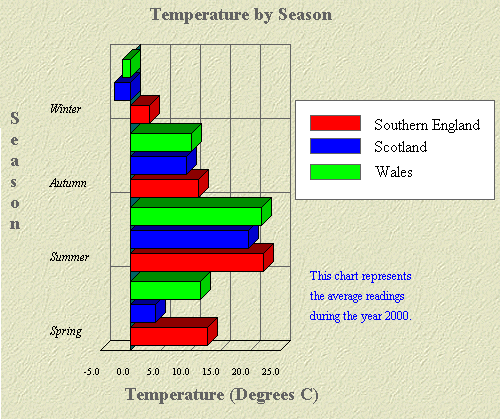
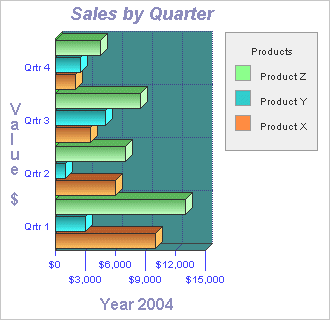 | This 2D / 3D Horizontal Bar Graph provides both a client and server side solution for the incorporation of bar graphs into web pages. It provides versatile components so that web authors and Java developers can easily build and publish dynamic and interactive bar graphs. We have built in many config...
|
 | Chart java applet software to generate dynamic charts and graphs - bar, line, pie, stacked and grouped charts in 2D and 3D with a wide range of parameters and chart types. Main features: Charts in 2D/3D, Anti aliasing, Multi language support, Cross browser compatible, Java Script parameter control, ...
|
 | This 3D Vertical Bar Graph provides both a client and server side solution for the incorporation of bar graphs into web pages. It provides versatile components so that web authors and Java developers can easily build and publish dynamic and interactive bar graphs. We have built in many configurable ...
Tags: bar graph, bar, graph, bar chart, chart, |
 | 3D Graphs & Charts is a series of Charting components which can be used both in intranet and internet web pages. The comprehensive documentation clearly demonstrates how to implement each component. With the examples (which include documented html code) you will quickly be able to incorporate these ...
|
 | This PHP script provides a very easy way to embed dynamically generated area graphs and charts into PHP applications and HTML web pages. The graphing software is very easy to use and it's perfectly possible to add professional quality real time graphing to web pages and applications within minutes. ...
|
 | Add Powerful reporting features to your Web / Intranet pages and applications. With advanced graphing you will be quickly adding impressive and dynamic charting capabilities bringing your data alive ! The PHP graphing scripts provide a very easy way to embed dynamically generated graphs and charts i...
|
 | 2D / 3D Area Graph provides both a client and server side solution for the incorporation of area graphs into web pages. It provides versatile components so that web authors and Java developers can easily build and publish dynamic and interactive area graphs. With many configurable features and funct...
|
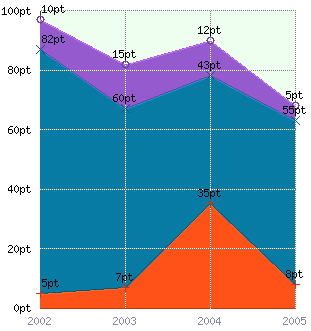
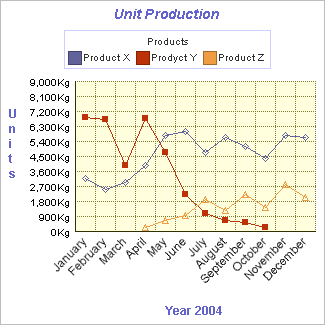 | The 2D / 3D Line Graph provides both a client and server side solution for the incorporation of line graphs and charts into web pages. It provides versatile components so that web authors and Java developers can easily build and publish dynamic and interactive line charts. Both the applet and servle...
Tags: line graph, line chart, line graph applet, line chart applet, line, graph, chart, java, applet, java applet, free java applet, |
 | Chart java applet software to generate dynamic charts and graphs within JSP, servlets or java applications - bar, line, pie, stacked and grouped charts in 2D and 3D with a wide range of parameters and chart types. Main features: Charts in 2D/3D, Anti aliasing, Multi language support, Cross browser c...
|
Shake! Spice Dice 3D -Lesbian Edition- Free - HalloHier! Pforzheim - FCB TimeRush - Burning Speaker -
FusionCharts (in Components and Libraries)
 | FusionCharts is a flash charting component that can be used to render data-driven & animated charts for your web applications and presentations. Made in Adobe Flash 8 (formerly Macromedia Flash), FusionCharts can be used with any web scripting language like HTML, .NET, ASP, JSP, PHP, ColdFusion, Rub...
|
| This PHP script provides a very easy way to embed dynamically generated area graphs and charts into PHP applications and HTML web pages. The graphing software is very easy to use and it's perfectly possible to add professional quality real time graphing to web pages and applications within minutes. ...
|
FusionCharts (in Components and Libraries)
 | FusionCharts is a flash charting component that can be used to render data-driven & animated charts in your web & dekstop applications and presentations. Its smart, user-friendly and innovative features liven up your web applications by converting monotonous data into exciting visuals. FusionCharts ...
|
| The Vertical Bar Graph API is a Java Bean Component. Designed specifically to enable programmers to easily add powerful graphing functionality to any form of Java application Download the Free Trial today for access to:- - Documentation - Code samples - Demo Applications - IDE specific instructions ...
|
 | AddFlow is an ActiveX control that lets you quickly build flowchart-enabled applications. Features such as distinct colors, fonts, shapes, styles, pictures, text, and so on for each object of the diagram (node or link) are available. Nodes stay connected when moved. Metafiles support, serialization,...
|
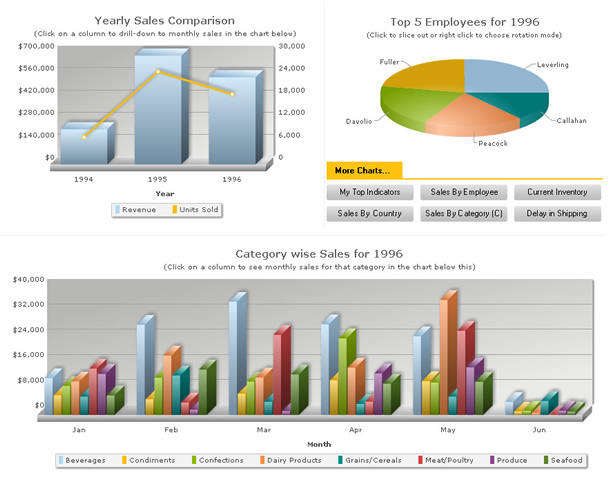
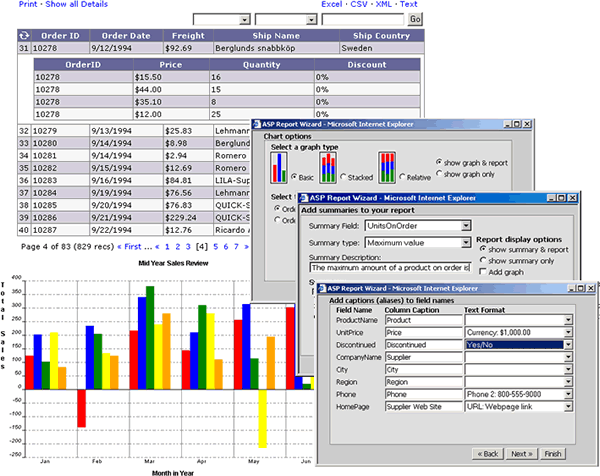 | The ASP Report Wizard is a multi-level web reporting component that is used to generate professional drill-down reports with as much 1 Click from virtually any data source. This version supports many features including fast dynamic reports, simple charts & graphs, multi-level data reporting, multipl...
|
 | Analyse It is a device poller that produces graphical performance reports for devices. You use it for trend analysis. The reports are in HTTP format for global organization view ability. Enables pro active network availability, performance, reliability and utilization reporting. Major Features: Moni...
Tags: snmp, tool, monitor, report, network, graph, analysis, free, response time, graphical, ip accounting, mib, cisco, nortel, health, noc, operation, easy, ip, windows, availability, reliability, performance, router, switch, free network tool, baseline, |
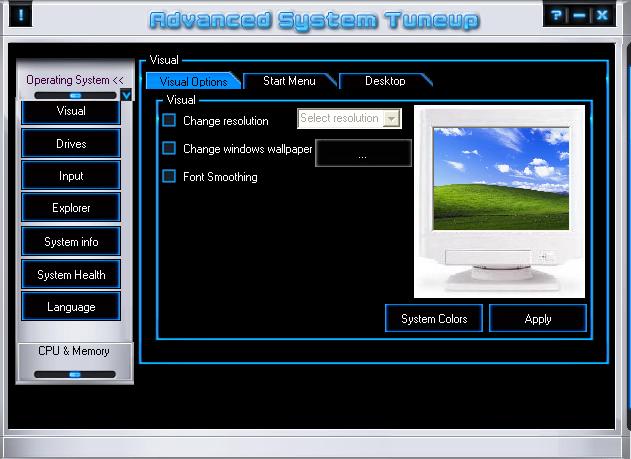 | Advanced System Tune up gives you the ability of checking your system performance, improving your system performance and repairing the system registry which is important to keep your system performing well. Advanced System Tune up consists of many useful modules, that can be launched from the startu...
|
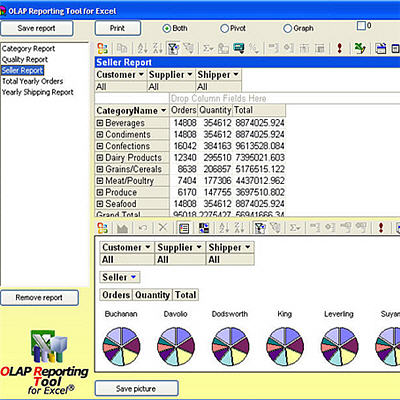 | Data for business intelligence (BI) is of little use until it is converted into the information that decision makers need. OLAP Reporting Tool for Excel facilitates business intelligence by helping management to explore and draw conclusions from huge amounts of data. The application extends the buil...
|
| SpreadsheetConverter is an add-on to Microsoft Excel that converts your spreadsheet to a good-looking live web page. Upload the web page to your blog or website and your spreadsheet is immediately available on the web. Add a Send button and test-drive the free form-to-Inbox service - it's so easy! W...
Tags: excel, spreadsheetconverter, convert excel, excel web, excel html, order form, excel to web, excel converter, convert excel to html, excel compiler, convert excel to web, excel to javascript, line chart, pie chart, bar chart, column chart, |
Visustin (in Development)
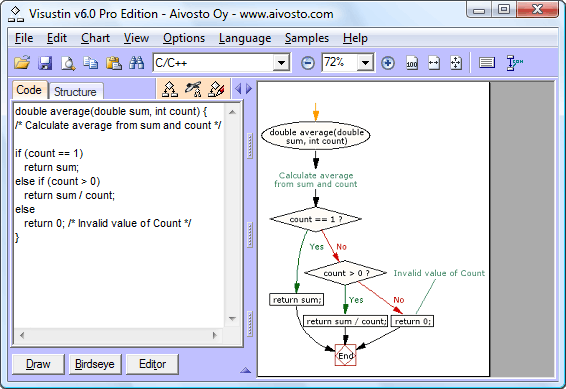 | Visustin is a flow chart generator for software developers. Automatically convert your source code to flow charts and UML Activity Diagrams. An optimized layout engine draws a flow chart of even your most complex functions and classes. Visustin reverse engineers your source code to visualize the if ...
|
 | MathProf is an easy to use mathematics program within approximately 180 subroutines. MathProf can display mathematical correlations in a very clear and simple way. The program covers the areas Analysis, Geometry, Algebra, Stochastics,Vector algebra.MathProf helps Junior High School students with pro...
|
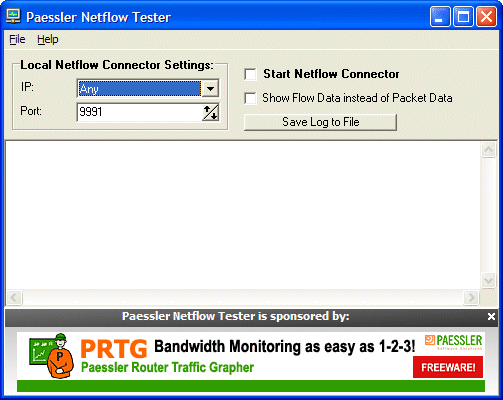 | Paessler Netflow Tester dumps the data of all Netflow packets that a computer receives from a Cisco router. This can be useful when debugging bandwidth monitoring configurations based on Cisco's Netflow protocol. First the Netflow protocol must be enabled and configured on the router. Then the route...
Tags: snmp, cisco, netflow, packet sniffer, packet sniffing, netflow, cisco, router, firewall, mrtg, bandwidth, usage, ip, volume, prtg, traffic, graph, network, monitor, monitoring, free, freeware, |
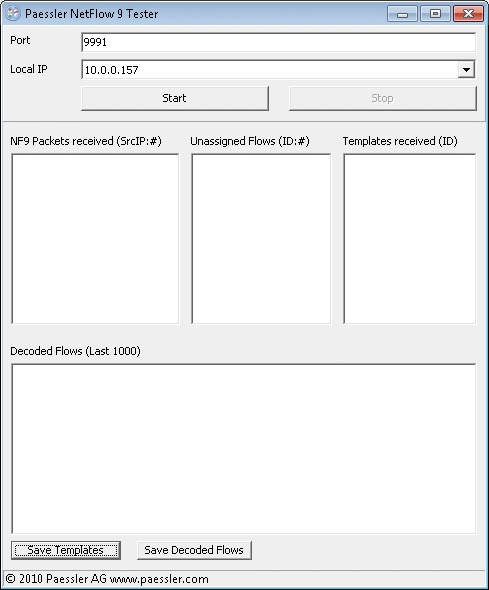 | Testing NetFlow Export Configurations. Our NetFlow Testers are small programs that simply dump the data of all NetFlow packets that a computer receives from a Cisco router. This can be useful when debugging bandwidth monitoring configurations based on Cisco's NetFlow protocol (both v5 and v9). First...
|
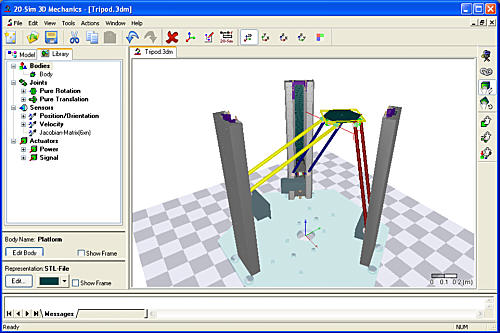 | 20-sim is an advanced modeling and simulation package for Windows. With 20-sim you can simulate the behavior of dynamic systems, such as electrical, mechanical and hydraulic systems or any combination of these. 20-sim models may use iconic diagrams, bond graphs, block diagrams as well as differentia...
|
|
|