|
|
Order by Related
- New Release
- Rate
Results in Title For 3d chart
 | 3D data visualization, charting, analysis and data mining in virtual reality (VRML). Program creates unique 3D scenes of your data. Allows you to explore and modify the scene. Large volumes of data records can bee seen in one screen. Multi dimensional data can be analysed easily. The extreme values can be evaluated in relation with the other data. Trends and rules in the data become visible.
3D ActiveChart can work as a stand alone version or as an add-in module to any other aplication. DBF files, ODBC databeses or DLL connection are supported.
3D ActiveChart is usefull for the end users as well as for the SW developers to enhance their products. Distributors and VARs are welcome worldwide. .. |
|
 | Easy Chart 3D GEO is easy to use wizard-like graphical reporting tool for effortless generation of complex business, management, financial and ad-hoc geographical pie charts (cylinder and cube shapes also available) of professional quality. Charts are generated on a top of a 3D geographical maps. Geographical Maps that are available: USA by states, USA states by counties, Europe by countries, Germany, Italy, United Kingdom, Spain, France, Austria, Australia, custom made maps and other on-demand maps.
Direct connection to Microsoft SQL Server, MS Access, Oracle and other databases (via ODBC) is available to fetch data from business systems (no place for human errors and very fast). Also, data can be Cut and Pasted from Microsoft Excel worksheets.
Graphical charts may be sent directly via email ('fire-and-forget' no-garbage technology) or saved to disk for later use in HTML WEB pages, business reports, marketing presentations or business meetings (suitable for LCD projectors and Screen Wall presentations).
Reports can be generated for English, German, Spanish, Italian, Chinese, Japanese or any other language (Unicode compatible).
Different output formats supported: 1) for image generation JPG (JPEG), TIFF, BMP, GIF, WMF and PNG format, 2) for animated reports AVI (Audio-Video Interchange) format so you can virtually 'fly over' your business regions and 3) smartCh@rt format (standalone interactive graphical business report format that does not require viewer on client side). SmartCh@rt is especially good for human communication inside organizations and companies because it promotes Paperless Office philosophy. Supports image resolutions from 200x200 to 2000x2000 pixels and 24-bit color depth. DirectX or OpenGL is NOT required.
For shorter transfer times and smaller memory footprint, ZIP compression option is available.
24-hour support team. Fast custom chart design team.
Get more info about program at GeoBrush's International site www.geobrush.com ..
|
|
 | This applet is designed to take multiple series of numerical data and display the information as a 3D Multi series Column Chart. The applet will automatically size itself to the available area given to it by the HTML form. .. |
|
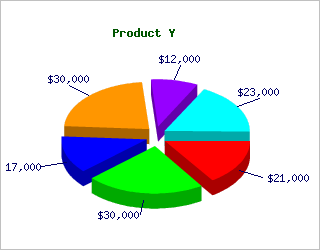
 | This applet is designed to take multiple series of numerical data and display the information as a set of 3D Multi series Pie Charts. The applet will automatically size itself to the available area given to it by the HTML form. (The WIDTH and HEIGHT of the APPLET tag.)
General Features
3D Mode
Outlines On/Off Color Selectable
Labels On/Off Font and Color Selectable
Number of Pies
Number of Series
Configurable Number of decimal places to show values
Label Orientation
Configurable Depth of the 3D effect
Display Values on Mouse Over events
URL link on Mouse Click Events
Upto 10 Free Form Images can be incorporated into the Chart Canvas
Upto 10 Free Form Lines of Text can be incorporated into the Chart Canvas ..
|
|
 | 3D Pie Chart provides both a client and server side solution for the incorporation of pie charts into web pages. Versatile components enable web authors and Java developers to easily build and publish dynamic and interactive pie charts. .. |
|
 | 3D Pie Chart provides both a client and server side solution for the incorporation of Pie Charts into web pages. It provides versatile components so that web authors and Java developers can easily build and publish dynamic and interactive Pie Charts. With many configurable features and functions to both applet and servlet, the documentation and examples are designed to give both a full understanding of every feature and enable you to implement both the applet and servlet quickly and easily. Now incorporates Anti-Aliasing to provide a much smoother and clearer pie image. New in this Release Percentage option on segment labels Added Parameters for Pre and Post symbols on the pop-up values Change Cursor on Mouseover links Multi Language Support URL Links for the Legend area. Enhanced Color parameter definitions to include hex and color names With a free trial and Money Back guarantee, try it out today. ..
|
|
 | This bean is feature packed and will enable you to add great looking Stacked Column Charts to your applications. We have grouped the features into several different data objects in order to make implementation simpler and more flexible.The documentation is both detailed and comprehensive and along with the tutorial style applet and application source code provided you should have no trouble creating your own implementations quickly and efficiently. .. |
|
 | 2D / 3D Pie Chart provides both a client and server side solution for the incorporation of Pie Charts into web pages. It provides versatile components so that web authors and Java developers can easily build and publish dynamic and interactive Pie Charts. With many configurable features and functions to both applet and servlet, the documentation and examples are designed to give both a full understanding of every feature and enable you to implement both the applet and servlet quickly and easily.With a free trial and Money Back guarantee, try it out today. .. |
|
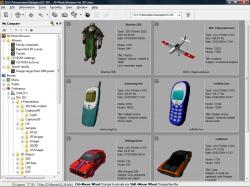 | 3D Photo Browser for 3D Users is a must for viewing, editing and organizing your images, videos, 3D files and audio files. It displays high quality thumbnails in a comfortable customizable window. You see your whole objects library thanks to the multi-folders view. It recognizes more than 60 image formats, many 3D formats and audio files.
You can describe each file using the keywords and information panel then export/import to/from a database or make advanced search based on this information.
The image viewer includes a wide range of tools, slides show, conversion and printing features.
The OpenGL viewer clearly shows scene hierarchy and materials, displays textures and includes slides show, conversion and printing features. It also includes a decimation tool to optimize your scenes.
You can play audio files and edit MP3 information (author, title, track...).
Nothing is more simple that printing a contact sheet of a directory content. You control accurately page setup (fonts, colors...) and can add information under each image using tags feature. Once your settings done, you can save them in the template library.
Batch command feature allows applying a set of commands to a set of files. For example, you can - in a single step - resize, rotate, then convert to 128 colors a set of images. Create your own batch command, save it, or load one of the samples from the batch command library.
Export your images or your 3D scenes to the web using the HTML format. Select the HTML template that fits your needs and let 3D Photo Browser for 3D Users do the job for you.
3D Photo Browser for 3D Users offers a wide range of advanced features, which list increases day by day, thanks to the regularly updates. For example, you can manage albums, send images by email (including resizing and conversion feature), capture still images or movie from screen, rename a set of files, manage your favorites directories, search for files, create AVI or animated GIF from a set of images... .. |
|
 | Chart Control .NET is the perfect solution to add the most advanced, feature rich charts to Windows Forms and ASP.NET applications. Over 40 major 2D/3D charts are available, such as traditional area, bar, column, line and pie charts, financial bars and Japanese candlesticks, Kagi and Renko charts and others. Flexible areas filling, scaling, legends, grid, context menus, and drill-down. Chart Control .NET allows using data from the XML, array of doubles and DataTable object. Chart Control .NET uses OpenGL (3D) and GDI+ (2D) for fast-rendering charts. Package includes Chart Control itself, XML driven toolbar, chart configuration control, and arts to decorate chart area. Chart Control .NET is written entirely in managed code. Not a .NET interface over a recycled ActiveX component. All error handling reports carried through .NET exception classes. Object-oriented design is created specifically for the .NET framework. 100% Unicode support. Chart can be used with C#, VB.NET, and Managed C++ as well as other languages which use .NET Framework. The layout (titles, fonts, colors, labels escapement etc) is flexible and can be changed at any time, so you can easily manage the style of your chart. Rich chart settings API allows you manage chart appearance from your code. Chart Themes that are the real chart building blocks allows you and your users create and load predefined (favorite) chart appearance. Ability to reload chart data on the fly allows you creating of the dynamic charts. .. |
|
Results in Keywords For 3d chart
 | Chart Wars is a music industry simulator putting you in charge of your own record label. In this role you must sign bands, release and promote records, arrange tours and much more, all whilst building up your company and attempting to balance the .. |
|
| 3D Pie Chart provides both a client and server side solution for the incorporation of pie charts into web pages. Versatile components enable web authors and Java developers to easily build and publish dynamic and interactive pie charts...
|
|
 | This PHP script provides a very easy way to embed dynamic area graphs to PHP apps and web pages. Very easy to use and it's perfectly possible to add professional quality real time graphing to web pages & apps within minutes. Try for free... |
|
| Skinning - Reusable design templates
Color palettes
Alpha blending
Gradients and Shadows
Watermarks
Numerous examples and code behind
Indexed and searchable manual
Live technical assistance available
Intuitive design based on over 15 years of charting experience
Financial formulas available
Statistical formulas available
Conditional chart appearance based on expressions and rules
Data sorting and filtering
Tooltips and drilldown..
|
|
| Skinning - Reusable design templates
Color palettes
Alpha blending
Gradients and Shadows
Watermarks
Numerous examples and code behind
Indexed and searchable manual
Live technical assistance available
Intuitive design based on over 15 years of charting experience
Financial formulas available
Statistical formulas available
Conditional chart appearance based on expressions and rules
Data sorting and filtering
Tooltips and drilldown.. |
|
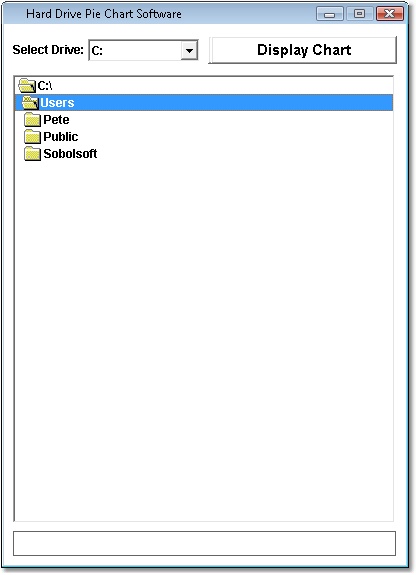 | Compare the size of folders with one another. Output is produced in an easy-to-read pie chart...
|
|
| 3D Pie Chart provides both a client and server side solution for the incorporation of Pie Charts into web pages. It provides versatile components so that web authors and Java developers can easily build and publish dynamic and interactive Pie Charts. With many configurable features and functions to both applet and servlet, the documentation and examples are designed to give both a full understanding of every feature and enable you to implement both the applet and servlet quickly and easily. Now incorporates Anti-Aliasing to provide a much smoother and clearer pie image. New in this Release Percentage option on segment labels Added Parameters for Pre and Post symbols on the pop-up values Change Cursor on Mouseover links Multi Language Support URL Links for the Legend area. Enhanced Color parameter definitions to include hex and color names With a free trial and Money Back guarantee, try it out today... |
|
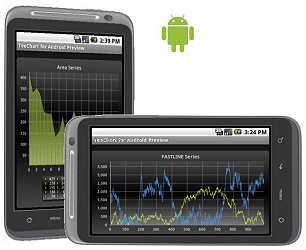 | Charting library for Android platform, written in native Android Java and supports most teechart series types including pie chart, line chart, points, area, bar, gauges and maps and 2D, 3D formats.The Charting library includes 100% native Java code... |
|
 | Bar Chart Applet Features: 3D bar chart applet. Animated parts. Configurable fonts and color. Easy to use... |
|
| 2D / 3D Pie Chart provides both a client and server side solution for the incorporation of Pie Charts into web pages. It provides versatile components so that web authors and Java developers can easily build and publish dynamic and interactive Pie Charts. With many configurable features and functions to both applet and servlet, the documentation and examples are designed to give both a full understanding of every feature and enable you to implement both the applet and servlet quickly and easily.With a free trial and Money Back guarantee, try it out today. .. |
|
Results in Description For 3d chart
 | Chart java application software to generate dynamic charts and graphs within JSP, servlets or java applications - bar, line, pie, stacked and grouped charts in 2D and 3D with a wide range of parameters and chart types... |
|
 | Chart java application software to generate dynamic charts and graphs within JSP, servlets or java applications - bar, line, pie, stacked and grouped charts in 2D and 3D with a wide range of parameters and chart types...
|
|
 | This applet is designed to take multiple series of numerical data and display the information as a 3D Multi series Line Graph. The applet will automatically size itself to the available area given to it by the HTML form. (The WIDTH and HEIGHT of the APPLET tag.)
The applet is easy to use and highly configurable and contains the following features,
General Features
3D Mode
Chart Grids On/Off Color Selectable
Chart Axis On/Off Color Selectable
Outlines On/Off Color Selectable
Labels On/Off Font and Color Selectable
Configurable Scale
Chart Starting Values
Number of Rows and Columns
Number of Series
Configurable Grid Starting x,y position
Configurable Number of decimal places to show values
Label Orientation
Configurable Depth of the 3D effect
Display Values on Mouse Over events
URL link on Mouse Click Events
Upto 10 Free Form Images can be incorporated into the Chart Canvas
Upto 10 Free Form Lines of Text can be incorporated into the Chart Canvas.. |
|
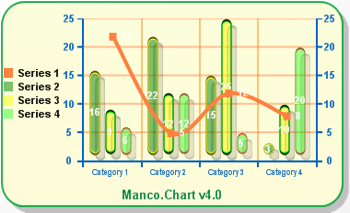
 | Manco.Chart for WPF is the perfect solution to add the most advanced, feature rich charts to Windows Presentation Foundation applications. Over 40 major 2D/3D charts are available, such as traditional area, bar, column, line and pie charts, financial bars and Japanese candlesticks, Kagi and Renko charts and others. Flexible areas filling, scaling, legends, grid, context menus, and drill-down. Manco.Chart for WPF allows using data from the XML, array of doubles and DataTable object. Package includes Chart Control itself, XML driven toolbar, chart configuration control, and arts to decorate chart area. Manco.Chart for WPF is written entirely in managed code. All error handling reports carried through .NET exception classes. Object-oriented design is created specifically for the .NET framework. 100% Unicode support. Chart can be used with C#, VB.NET, and Managed C++ as well as other languages which use .NET Framework. The layout (titles, fonts, colors, labels escapement etc) is flexible and can be changed at any time, so you can easily manage the style of your chart. Rich chart settings API allows you manage chart appearance from your code. Chart Themes that are the real chart building blocks allows you and your users create and load predefined (favorite) chart appearance. Ability to reload chart data on the fly allows you creating of the dynamic charts...
|
|
 | The NChartEditor application is an integrated chart creation environment, designed to help you create stunning 2D and 3D chart images that can be exported to JPEG, PNG, TIFF, TGA, Bitmaps, SVG and HTML image maps. The key features of the application are:
.. |
|
| MistyChart is a java based charting component. MistyChart requires java Plug-in 1.4. MistyChart supports close to 50 chart formats. Some of the chart formats supported are pie, column, 3d column, stock, etc. MistyChart allows displaying any of the supported chart types using the popup menu.MistyChart can be customized at design time using the rich API set provided...
|
|
 | The 3DChart component is a powerful charting tool using the OpenGL 3D engine to display 2D and 3D business, scientific and presentation charts. It supports all basic charting types with lots of different style and logic variations. All chart type combinations can be simultaneously displayed. 3DChart has four vertical axes plus one category and serie axis. It has an integrated legend. The data can be extracted from an ADO data source. Fill Effects and materials can be applied on all chart elements including individual data points and texts. The component is COM and .NET compatible. The key features of the component are: .. |
|
 | Chart Component .NET is a powerful charting component used to create attractive 3D and 2D charts for desktop applications and web pages using .NET technologies. 3D charting uses the OpenGL graphics engine to create sophisticated 3D charts and graphs... |
|
 | Easy to create flow chart, org chart, business chart, mind map, calendar, family tree, gantt chart, project management, business form, timeline, bpmn, UML diagrams, workflow, building plan, science illustration, network diagram and map... |
|
| Charting library for Android platform, written in native Android Java and supports most teechart series types including pie chart, line chart, points, area, bar, gauges and maps and 2D, 3D formats.The Charting library includes 100% native Java code... |
|
Results in Tags For 3d chart
 | Nevron Chart for .NET is designed to be extensible, efficient and feature rich. It wraps a vast amount of features in an intuitive and straightforward programming model. The component can display virtually any 2D or 3D chart including: Bar, Line, Step Line, Area, Pie, Point, Bubble, Stock, Floating Bar, Radar, Polar, High Low, Mesh Surface, Grid Surface, Shape, Smooth Line, Float Bar, Venn and Error with many variations (like Scatter XY and XYZ Line, Stacked Bars etc.). Other charting features include scrollable axes, integrated legend, chart annotations, watermarks and very extensible chart layout manager. The component features full Visual Studio design time support with many advanced features like style editors allowing you to quickly modify the chart with the visual interface only. The control also includes a custom toolbar and an integrated data grid components that can come handy in advanced charting applications requiring high degrees of interactivity features.
Key Features:
- Display any chart in 2D and 3D
- A set of predefined financial and statistical functions
- Built-in Serializer and Print Manager
- Utilizes both OpenGL and GDI+ rendering without sacrificing speed
- Photoshop like image filters
- Document-View.. |
|
 | .Net Window Form Chart Components can be widely applied in many industry HMI applications, financial and insurance applications, scientific research and analytical applications, development-simulation applications..
|
|
| Easy Chart 3D GEO is easy to use wizard-like graphical reporting tool for effortless generation of complex business, management, financial and ad-hoc geographical pie charts (cylinder and cube shapes also available) of professional quality. Charts are generated on a top of a 3D geographical maps. Geographical Maps that are available: USA by states, USA states by counties, Europe by countries, Germany, Italy, United Kingdom, Spain, France, Austria, Australia, custom made maps and other on-demand maps.
Direct connection to Microsoft SQL Server, MS Access, Oracle and other databases (via ODBC) is available to fetch data from business systems (no place for human errors and very fast). Also, data can be Cut and Pasted from Microsoft Excel worksheets.
Graphical charts may be sent directly via email ('fire-and-forget' no-garbage technology) or saved to disk for later use in HTML WEB pages, business reports, marketing presentations or business meetings (suitable for LCD projectors and Screen Wall presentations).
Reports can be generated for English, German, Spanish, Italian, Chinese, Japanese or any other language (Unicode compatible).
Different output formats supported: 1) for image generation JPG (JPEG), TIFF, BMP, GIF, WMF and PNG format, 2) for animated reports AVI (Audio-Video Interchange) format so you can virtually 'fly over' your business regions and 3) smartCh@rt format (standalone interactive graphical business report format that does not require viewer on client side). SmartCh@rt is especially good for human communication inside organizations and companies because it promotes Paperless Office philosophy. Supports image resolutions from 200x200 to 2000x2000 pixels and 24-bit color depth. DirectX or OpenGL is NOT required.
For shorter transfer times and smaller memory footprint, ZIP compression option is available.
24-hour support team. Fast custom chart design team.
Get more info about program at GeoBrush's International site www.geobrush.com.. |
|
 | Aspose.Chart is a .Net charting component. With it, you can: ceeate more than 20 basic charts types including Area, Bar, Bubble, Contour, Candlestick, Cube, Curve, CurveArea, Doughnut, Gantt, HighLowClose, Line, OpenHighLowClose, Pareto, Pie, Pyramid, Point, Radar, Scatter, Step, Surface, etc; Create charts with effects including 3D, frame border, anti-alias, transparency, grandient, custom drawing, chart combination, custom attributes, etc. Create charts via API, XML or combined API and XML. Create charts for Windows Forms applications and Web Forms applications. Customize your charting application in minutes from fully-featured demos both in C# and Visual Basic .Net. The latest version made a number of changes to the API ;Completely revised the API documentation;etc...
|
|
 | ActiveX Automation HMI Componentcan be widely applied in many industry HMI applications and Simulation environments.. |
|
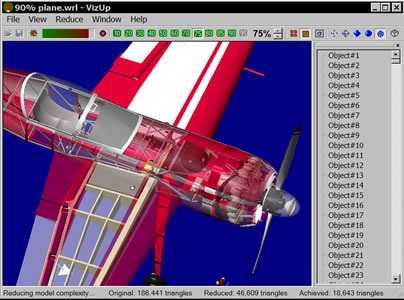 | VizUp Streamline is designed specially for game developers, architects, and 3D designers. With this software in place, they can reduce polygons and optimize 3D models. Supports Wavefront .OBJ, VRML 2.0/97 and StereoLitho (.STL) file formats...
|
|
 | Easy 3D Objects is intended for creation of 3D GIF- animations, banners, illustrations for the Web and presentation materials. You can use different types of objects,assign animation paths to objects, fill objects by color or texture and more..... |
|
 | Fun for all ages! Build and paint this "ready to assemble" high detail 3D Model Kit and learn why 3D is so creative and exciting!.. |
|
 | Fun and Easy for all ages! Build and paint this "ready to assemble" high detail 3D Model Kit and learn why 3D is so creative and exciting!.. |
|
 | Fun and Easy for all ages! Build and paint this "ready to assemble" high detail 3D Model Kit and learn why 3D is so creative and exciting!.. |
|
Related search : hart netdragonfly chart,net dragonfly charteasy chart,geo easy chartcreate chartsaspose chart,etc create chartschart aspose chartaspose chart asposeactivex components,visual basic visualchart activex componentsgraphic chart activexvizup streamline,,kOrder by Related
- New Release
- Rate
3d game 3d games -
i chart -
r value chart -
s chart -
in the chart -
|
|