|
|
Order by Related
- New Release
- Rate
Results in Title For create charts
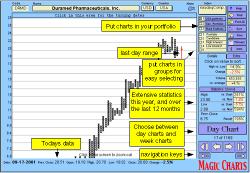 | Tool to follow the stock market using Point and Figure charts. Get a full set of updated Point and Figure charts every day in your mailbox and select easily which stock to buy and sell with the new Buy the Winner view. Comes with build in portfolio. .. |
|
 | Theory of Biorhythm:
In early 20th century, Germany physician Wilhelm Fliess and Austrian psychologist Hermann Swoboda found human being Biorhythm cycles that emotion has a cycle of 28-days and physical has a cycle of 23-days.
After twenty years, Austrian professor Alfred Teltseher found that human being intelligence has a cycle of 33-days after studying hundreds of students. Now we know the following human being biorhythm cycles: Emotion cycle is 28-days. Physical cycle is 28-days. Intelligence cycle is 33-days. The start day to calculate a person's biorhythm is his( or her) birthday.
Benefits:
Predict your status in future. Arrange travel or important work. Calculate the best pregnant dates for a couple. Adjust your status and get high score in exam. Help you to decide whether he or she is your cup of tea. Help to affiliate better with your mate. Display two persons' biorhythm charts once. By comparing two persons' biorhythm charts you can predict their advantages and disadvantages.
Features of Biorhythm Charts:
Display one or two persons' biorhythm charts once.
Compare two persons' biorhythm charts
Adjust your status before exam to get a high score in the exam.
Find the best pregnant dates for a couple and have a healthy baby.
See whether a person is appropriate for you to become a happy family.
Seek mate.
Print biorhythm charts. ..
|
|
 | World Stock Charts is a complete solution for Charting and Tracking Stocks, Funds and Indices with over 50 Forms of Technical Analysis built into it. .. |
|
 | Theory of Biorhythm:In early 20th century, Germany physician Wilhelm Fliess and Austrian psychologist Hermann Swoboda found human being Biorhythm cycles that emotion has a cycle of 28-days and physical has a cycle of 23-days.After twenty years, Austrian professor Alfred Teltseher found that human being intelligence has a cycle of 33-days after studying hundreds of students. Now we know the following human being biorhythm cycles: Emotion cycle is 28-days. Physical cycle is 28-days. Intelligence cycle is 33-days. The start day to calculate a person's biorhythm is his( or her) birthday.Benefits: Predict your status in future. Arrange travel or important work. Calculate the best pregnant dates for a couple. Adjust your status and get high score in exam. Help you to decide whether he or she is your cup of tea. Help to affiliate better with your mate. Display two persons' biorhythm charts once. By comparing two persons' biorhythm charts you can predict their advantages and disadvantages.Features of Biorhythm Charts: Display one or two persons' biorhythm charts once.Compare two persons' biorhythm charts Adjust your status before exam to get a high score in the exam.Find the best pregnant dates for a couple and have a healthy baby.See whether a person is appropriate for you to become a happy family.Seek mate.Print biorhythm charts. ..
|
|
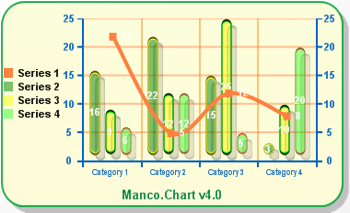
 | ADSS Charts Control designed to display three types of Charts: Horizontal bar Chart, Vertical bar Chart, Pie Chart, key Features: supports Captions and Values.
Text can be aligned,control allows to display text information inside and outside chart elements.
Chart data can be grouped in Groups. Can be updated in real-time for creating of animated Charts. Control provides high quality image. .. |
|
 | Point & Figure Charts software is a stock analysis tool for individual investors and traders to identify buy-and-sell signals. The premier feature is Point & Figure Chart that is implemented with classic scale and custom scale. and much more. ..
|
|
| Advanced Trading Research provides extremely accurate trading tools for institutions and day traders. We in real time analyze order flow sent to electronic trading systems and ECNs such as Island. The source data we receive is similar to the data other companies like 3D stockcharts use but the use and end result differ vastly.
We have during the last two years developed, patented and are now marketing our first generation tool which we call the True Trend Charts. The True Trend Charts does what it's name indicates, it in real-time shows in a very easy to use graph exactly how over- or undervalued the intraday market is at any given time throughout the trading day. This allows a trader to know if a current move in the intraday market is false and if it is extremely likely to reverse.
The True Trend charts also show the true intraday support and resistance of the major market indices. It is so accurate that it very often can tell you several hours in advance what direction the market will go in and exactly on the cent where the market will stop or reverse. Traders often can profit from intraday market swings of several percent since we give them a reference of if the intraday market is high or low. .. |
|
 | Add Powerful reporting features to your Web / Intranet pages and applications. With the advanced graphing package you will be quickly adding impressive dynamic charting capabilities bringing your data alive Powerful components provide both client server side solutions for adding graphs charts into web / intranet pages applications. Enabling web authors Java developers to easily build and publish dynamic interactive graphs charts. .. |
|
 | North American Mileage Charts and Tables stored as Excel 2007 workbooks, including travel times and distances for both the fastest and shortest routes. Includes a table for N.America; plus tables for every US State and Canadian Territory. .. |
|
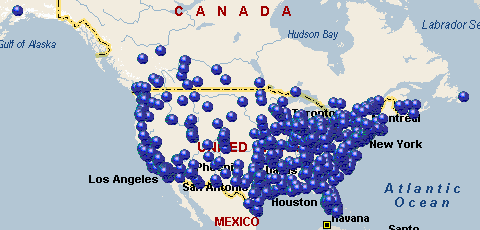 | North American Mileage Charts and Tables stored as Excel 2007 workbooks, including travel times and distances for both the fastest and shortest routes. Includes a table for N.America; plus tables for every US State and Canadian Territory. .. |
|
Results in Keywords For create charts
 | ELChart library is the powerful tool that allows to create programs with various charts. Library offers flexible GDI based solution that allows you to create animated, compact and great looking charts.
With ELChart you you can create various charts such as financial charts, mathematical plots, diagrams etc, save chart to BMP file, create linear-law and square-law trend according to input data. Installation package has documents and free examples... |
|
 | Aspose.Chart is a .Net charting component. With it, you can: ceeate more than 20 basic charts types including Area, Bar, Bubble, Contour, Candlestick, Cube, Curve, CurveArea, Doughnut, Gantt, HighLowClose, Line, OpenHighLowClose, Pareto, Pie, Pyramid, Point, Radar, Scatter, Step, Surface, etc; Create charts with effects including 3D, frame border, anti-alias, transparency, grandient, custom drawing, chart combination, custom attributes, etc. Create charts via API, XML or combined API and XML. Create charts for Windows Forms applications and Web Forms applications. Customize your charting application in minutes from fully-featured demos both in C# and Visual Basic .Net. The latest version made a number of changes to the API ;Completely revised the API documentation;etc...
|
|
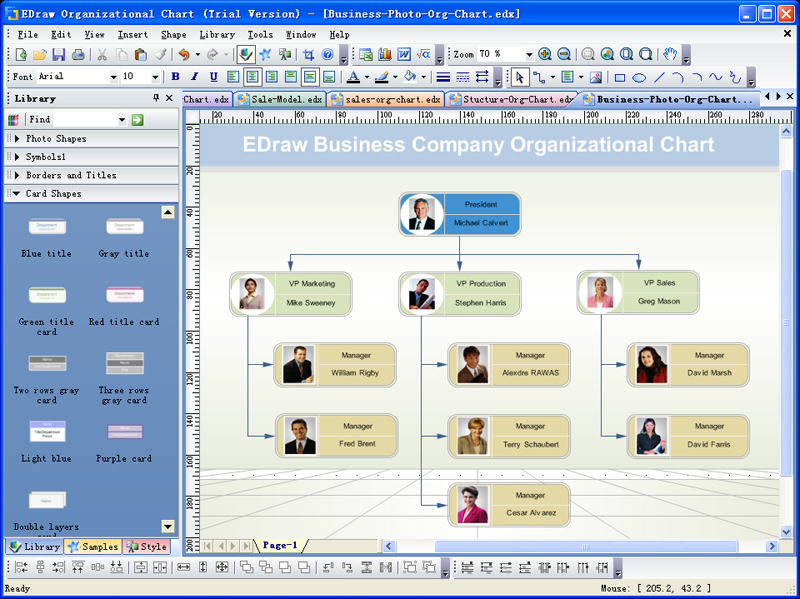
| OrgChart Professional sets the new standard in organizational charting software. Combining easy-to-use tools with powerful database functionality, OrgChart is used by HR professionals world-wide. Create professional org charts in minutes... |
|
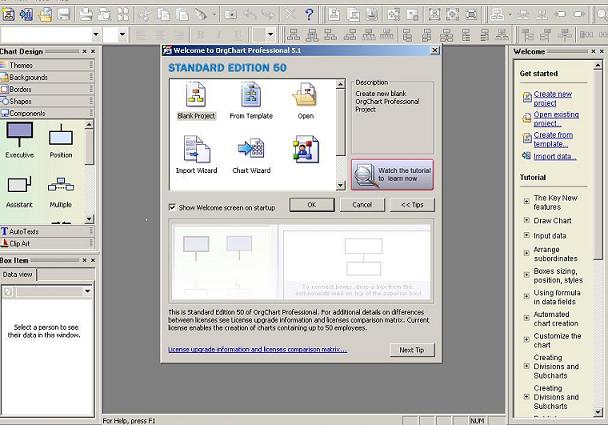 | Create Organization Structure Chart with our Professional Orgchart Standard Software. OrgChart Standard is a fantastic tool to quickly create your organizational chart software and employee performance chart...
|
|
 | Create Organization Structure Chart with our Professional Orgchart Standard Software. OrgChart Standard is a fantastic tool to quickly create your organizational chart software and employee performance chart... |
|
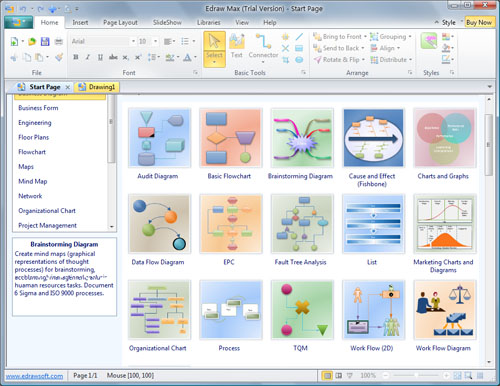
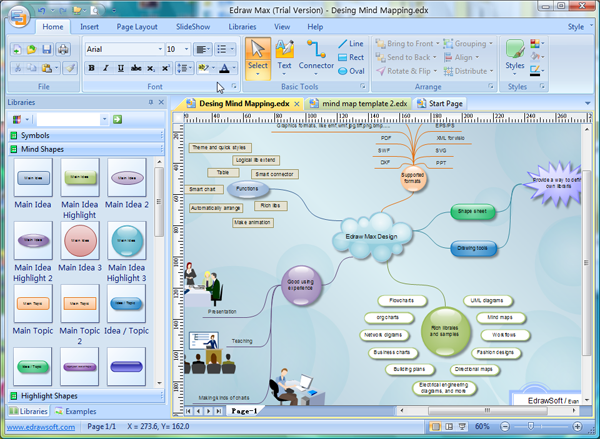 | Edraw Max is a vector-based diagramming software with rich examples and templates. Easy to create flow charts, organizational charts, business charts, Mind map, UML diagrams, workflows, program structures, network diagrams, maps and databse diagrams...
|
|
 | Rich Chart Server generates captivating dynamic Flash charts from ASP.NET. Visually design a chart template with animation, audio, annotations and links. Apply the template to any available .NET data source to generate a interactive Flash chart... |
|
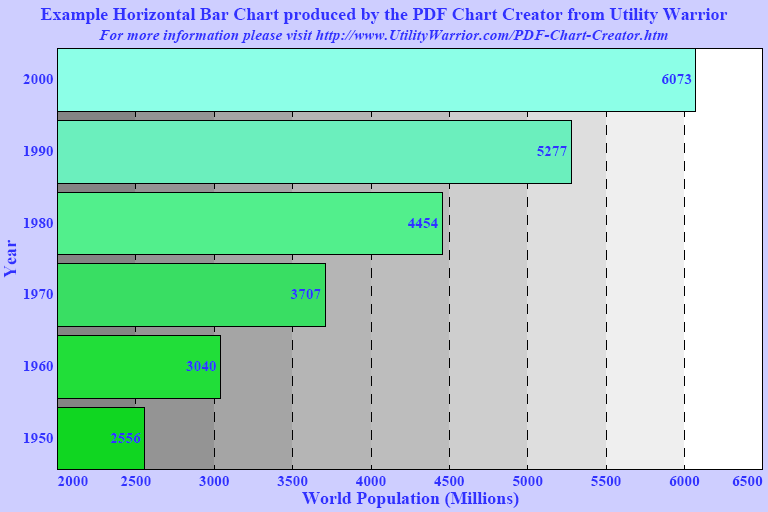 | PDF Chart Creator is a utility that converts data into a chart PDF document. The conversion process is initiated by calling PDFChart.exe directly from the command line, or from within a batch file, with parameters that control it`s operation... |
|
 | Scan Workshop / NeoTicker EOD is an advanced investment tool with easy to use intelligent scanning, intraday quotes, animated tickers, portfolio tracking and programmable technical analysis stock charting. It is designed for people who require a sophisticated stock analysis tool beyond what websites and brokers can offer. Scan Workshop is built on top of NeoTicker EOD to perform advance scanning. NeoTicker EOD lets you create a window to monitor intraday quotes and helps you track your portfolio. Quotes and portfolio tracking are updated automatically by periodically downloading data from the Internet. Charts come with over 120+ built-in customizable technical indicators. Indicators can be applied on other indicators with a few mouse clicks to create complex indicators. For example, you can apply a moving average on an oscillator. Extensive drawing tools are available to let you draw Fibonacci, trend lines, channels, support/resistance lines, fans and text on the charts. You can even create your own drawing tool. Charts allow you to mix data of different time frames. For example, you can compare a 5 year chart with weekly bars and monthly bars. You can open multiple charts in NeoTicker EOD. Each chart can contain any number of stocks and indicators. NeoTicker EOD allows the grouping of windows and lets you manage large number of quote windows and chart windows with ease. NeoTicker EOD can read free Internet data and supports multiple data vendors and data formats, including Quote Plus, TC2000, Metastock, CSI/CSIM and ASCII. NeoTicker EOD is programmable and you can create your own indicators and backtest trading systems. NeoTicker EOD comes with an integrated development environment and supports formula, VBScript, JavaScript and Delphi Script. Compatible with Windows 98, ME, NT4(sp4), 2000(sp1), and XP. System Requirements: Pentinum II, 1024x768, 256 colors 128M RAM 10M hard disk space; Internet connection or access to supported data vendors/formats... |
|
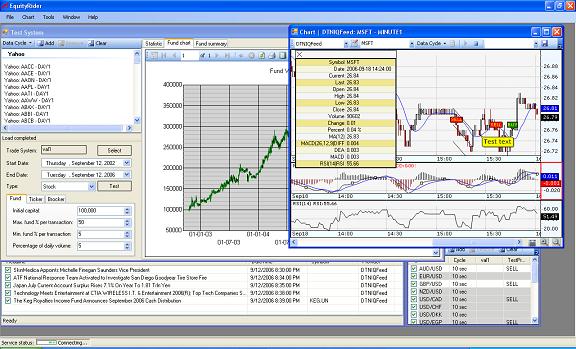 | EquityRider is an advanced stock charting and trading systems analysis software for many markets: stocks, forex, and futures. It allows you to create custom indicators, derive indicators based on standard ones, and plot them on charts Real-Time .. |
|
Results in Description For create charts
| Edraw Max is a vector-based diagramming software with rich examples and templates. Easy to create flow charts, organizational charts, business charts, Mind map, UML diagrams, workflows, program structures, network diagrams, maps and databse diagrams... |
|
| Create charts with high-impact effects normally reserved for professionals! Transform your reports, spreadsheets, memos, presentations and Web pages with just a few mouse clicks! Harvard Instant Charts coordinates the graphic elements for your layouts, colors, textures, illustrative charts and graphs to create powerful, high-impact communications! Using the power of this remarkable, patented technology, Harvard Instant Charts "understands" the relationship between visual graphics and data and text layout--even when you don.t--and automatically coordinates the design process for you. The result is that professional-level graphics may be designed with virtually effortless ..
|
|
 | Edraw is a new organization chart drawing software, which creates organisation charts and business charts with minimum time loss for you. Support basic flowcharts, organizational charts, business charts, hr diagram and work flowchart... |
|
 | Set of Php Classes for creating charts and graphs. It supports more than 18 types (linechart, piechart, barchart, radarchart, curves , gauges, 3D charts, Candlestick, areacharts ....) and combinations of them.
It supports also database access, automatic scales (dates and logarithmic) and interactive features using image maps (tips and links). You can create charts with minimum programming...
|
|
| Java charts. Bean , Applet and servlet that will create charts for your web site of java application. It supports more than 18 2D and 3D types of charts and combinations of them. It supports interactive features like zoom , scroll, tips and links. It can be used with HTML, JSP, Php, ASP , java and will work with old browser also.
Includes RChart Visual Builder for easy design... |
|
 | Rich Chart Builder transforms your data charts into enjoyable and captivating communication. Data charts don't have to be plain and austere, they can be interactive experiences with attractive visuals, animation and even voice explanations describing the important facts behind the numbers.
Features and Benefits:
- Impressive Charts: Create stunning Rich Media charts that present data in an enjoyable and captivating experience. Includes sophisticated 3D and shaded chart styles.
- Interactivity: Create interactive charts with tooltips and drill-down links that can point to other charts and web documents, creating a truly interactive experience.
- Communication: Charts can contain an audio narration - an effective way of describing the events behind the values.
- Flash Rich Media: Publish the animated charts to Macromedia Flash format, viewable by over 98% of web users.
- Publish to PowerPoint: Impress audiences with compelling charts published to PowerPoint presentations. Also publish to image and PDF documents.
- Templates and Layouts: Enhance data charts with a wealth of professionally designed chart Templates and Layouts.
- Simple Data Import: Works with Microsoft Office - easily import data from Excel. Also import data from other spreadsheets.
- Unicode Support: Supports charts with values in Japanese, Chinese and other Unicode languages...
|
|
| EasyCharts is a complete library of java chart components, chart applets, and chart servlets that enable programmers to add charts and graphs in java applications, web applications, and web pages with just a few lines of code. The java chart library includes bar charts, line charts, and pie charts and is highly configurable. The java chart library supports charts with multiple data series, overlay charts, drilldown charts, and interactive features such as zooming and scrolling of chart data. The charts are compatible with JDK 1.2 or newer so it works on all major web browsers with no additional addons other than a standard Java Virtual Machine installed. The chart library footprint is only 110KB... |
|
| Aspose.Chart is a .Net charting component. With it, you can: ceeate more than 20 basic charts types including Area, Bar, Bubble, Contour, Candlestick, Cube, Curve, CurveArea, Doughnut, Gantt, HighLowClose, Line, OpenHighLowClose, Pareto, Pie, Pyramid, Point, Radar, Scatter, Step, Surface, etc; Create charts with effects including 3D, frame border, anti-alias, transparency, grandient, custom drawing, chart combination, custom attributes, etc. Create charts via API, XML or combined API and XML. Create charts for Windows Forms applications and Web Forms applications. Customize your charting application in minutes from fully-featured demos both in C# and Visual Basic .Net. The latest version made a number of changes to the API ;Completely revised the API documentation;etc... |
|
 | Chart Component .NET is a powerful charting component used to create attractive 3D and 2D charts for desktop applications and web pages using .NET technologies. 3D charting uses the OpenGL graphics engine to create sophisticated 3D charts and graphs... |
|
 | PowerSheet is a powerful spreadsheet that is easy to use and helps you to design feature-rich report templates, store, manipulate, analyze, and visualize data and deliver it as information inside and outside the organization.
PowerSheet can be used to organize and present quantifiable data for enterprise, government, school, and personal projects. It can be used to create and update budgets, to analyze research data, to create finance reports, and in many situations to answer the question "what if?" as it relates to quantitative data.
The three major parts of PowerSheet are:
Template Template is a table that allow you to enter, calculate, manipulate and analyze data such as numbers and text.
Data CFor example, once you enter data onto a template, PowerSheet can sort the data, search for specific data, and select data that meets certain criteria. Data may be saved to a data file or a database that is separate from Template.
Charts Charts pictorially represent data. PowerSheet can draw two-dimensional and three-dimensional column charts, pie charts and other types of charts... |
|
Results in Tags For create charts
 | RMChart is a simple to use and lightweight ActiveX control to add a various range of modern looking business charts (Bar, Line, Pie/Donut, XY scatter) to your applications. It comes with RMCDesigner: This is a tool, which allows you to create a chart with all aspects entirely without coding, just point and click and see immediately the resultant chart. The source code for various development systems of the chart you've created in the designer is only a mouse click away - just paste it in a form and run the code. Or get the plain data string of the created chart, store it in your application or a resource file and "play back" your static charts with only two lines of code. Of course you can easily print your charts or save them as *.jpg/*.png files from within your applications... |
|
 | Easy to create flow chart, org chart, business chart, mind map, calendar, family tree, gantt chart, project management, business form, timeline, bpmn, UML diagrams, workflow, building plan, science illustration, network diagram and map...
|
|
| Aspose.Chart is a .Net charting component. With it, you can: ceeate more than 20 basic charts types including Area, Bar, Bubble, Contour, Candlestick, Cube, Curve, CurveArea, Doughnut, Gantt, HighLowClose, Line, OpenHighLowClose, Pareto, Pie, Pyramid, Point, Radar, Scatter, Step, Surface, etc; Create charts with effects including 3D, frame border, anti-alias, transparency, grandient, custom drawing, chart combination, custom attributes, etc. Create charts via API, XML or combined API and XML. Create charts for Windows Forms applications and Web Forms applications. Customize your charting application in minutes from fully-featured demos both in C# and Visual Basic .Net. The latest version made a number of changes to the API ;Completely revised the API documentation;etc... |
|
| ELChart library is the powerful tool that allows to create programs with various charts. Library offers flexible GDI based solution that allows you to create animated, compact and great looking charts.
With ELChart you you can create various charts such as financial charts, mathematical plots, diagrams etc, save chart to BMP file, create linear-law and square-law trend according to input data. Installation package has documents and free examples...
|
|
| ADSS Charts Control designed to display three types of Charts: Horizontal bar Chart, Vertical bar Chart, Pie Chart, key Features: supports Captions and Values.
Text can be aligned,control allows to display text information inside and outside chart elements.
Chart data can be grouped in Groups. Can be updated in real-time for creating of animated Charts. Control provides high quality image... |
|
| Rich Chart Builder transforms your data charts into enjoyable and captivating communication. Data charts don't have to be plain and austere, they can be interactive experiences with attractive visuals, animation and even voice explanations describing the important facts behind the numbers.
Features and Benefits:
- Impressive Charts: Create stunning Rich Media charts that present data in an enjoyable and captivating experience. Includes sophisticated 3D and shaded chart styles.
- Interactivity: Create interactive charts with tooltips and drill-down links that can point to other charts and web documents, creating a truly interactive experience.
- Communication: Charts can contain an audio narration - an effective way of describing the events behind the values.
- Flash Rich Media: Publish the animated charts to Macromedia Flash format, viewable by over 98% of web users.
- Publish to PowerPoint: Impress audiences with compelling charts published to PowerPoint presentations. Also publish to image and PDF documents.
- Templates and Layouts: Enhance data charts with a wealth of professionally designed chart Templates and Layouts.
- Simple Data Import: Works with Microsoft Office - easily import data from Excel. Also import data from other spreadsheets.
- Unicode Support: Supports charts with values in Japanese, Chinese and other Unicode languages...
|
|
| World Stock Charts is a complete solution for Charting and Tracking Stocks, Funds and Indices with over 50 Forms of Technical Analysis built into it... |
|
| Edraw Max is a vector-based diagramming software with rich examples and templates. Easy to create flow charts, organizational charts, business charts, Mind map, UML diagrams, workflows, program structures, network diagrams, maps and databse diagrams... |
|
| Rich Chart Server generates captivating dynamic Flash charts from ASP.NET. Visually design a chart template with animation, audio, annotations and links. Apply the template to any available .NET data source to generate a interactive Flash chart... |
|
 | FusionCharts v3 helps you create animated and interactive Flash charts for web and desktop applications. It livens up your applications by converting monotonous data into exciting visuals... |
|
Related search : ibraries andmind mapedraw max,5000 vector symbolsvector symbols drawingsymbols drawing couldn`tpre drawn librariesorganizational charts businessflow charts organizationalcharts organizational chartscreate flow chartscreate chartsaspose chart,etc creaOrder by Related
- New Release
- Rate
stock charts com -
in cell charts -
flip charts -
powerpoint charts -
java charts -
|
|