|
|
Order by Related
- New Release
- Rate
Results in Title For performance visualization
 | Visualize GPS information such as satellite location, signal strength, bearing and direction to destination with this lightweight, flicker-free .NET user control. Includes properties to allow the control to blend with any user interface, including support for transparency. Requires GPS.NET Global Positioning SDK. .. |
|
 | UCanCode provides a complete set of services, consisting of design tools and a software development kit (SDK), for developers who want to create a user interface for industrial monitoring and process control drawing SCADA applications. ..
|
|
 | UCanCode Softwareis a world-class Power Engineering Solutions provider with an established reputation for customer responsiveness and technical expertise. Our solutions stand behind thousands of T&D projects in over 40 countries around the world. .. |
|
 | UCanCode BPM C++ Extension Library with 100% BPM and workflow features, build Advanced Diagrams and Dashboards for Business Process Management (BPM) in minutes ..
|
|
 | UCanCode Software Inc. is a premier provider of Dynamic Graphics, Data Visualization, Human-Machine Interface (HMI) and Real-Time Mapping Solutions for software developers around the world. .. |
|
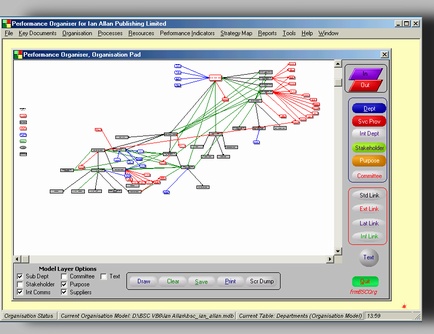 | Organisation modelling software designed to suport a number of management planning techniques. Iit is a general purpose business analysts toolkit. ..
|
|
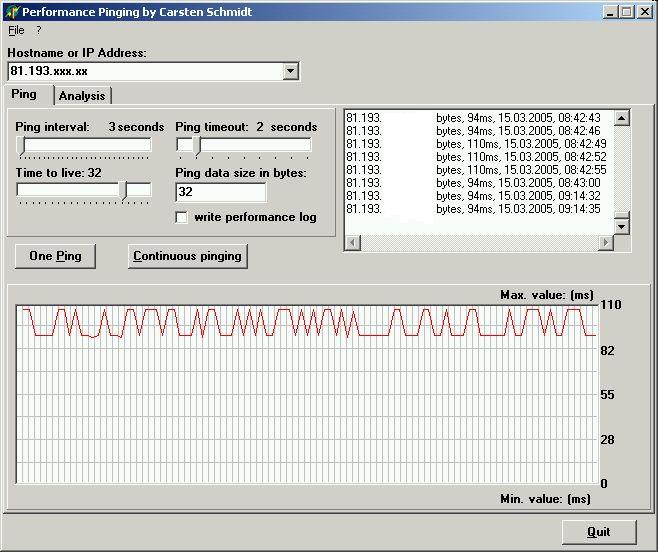 | Performance Pinging, Perfping.exe
Version 2.0.0; March 2006
How does it work and what does it do?
Perfping is a tool that allows you to ping a host continuously or with a single
ping using different data volumes. This can give you an indication of the
performance of the route to your host. You can change the ping interval from 2
to 30 seconds using various timeouts. The timeout is always smaller than the pinging
interval. Results are written to log window and log file if so chosen.
Unreachable hosts have a value of 0 ms.
The analysis function sends various pings, 10 each of 10 bytes, 100 bytes, 500
bytes, 1 kbytes, 10 kbytes, 50 kybytes and 64 kbytes. The round trip times are
shown with the total and average times.
Comments:
- Errors are written to file and log window but may be shown later than
successfull pings when changing ping intervall and timeout during runtime
- Thanks to Francois Piette for the internet component suite, Angus Robertson
for the threaded version of Ping and Dr. Jurgen Kehrel for the graph component. .. |
|
 | Creates a second Window in IE, lets you load pages in the new window, and then when you click on a link in the new window, it brings up the target site in the original window. It's useful for efficient work with search engines, catalogs, big navigation structures, huge pages, and so on... .. |
|
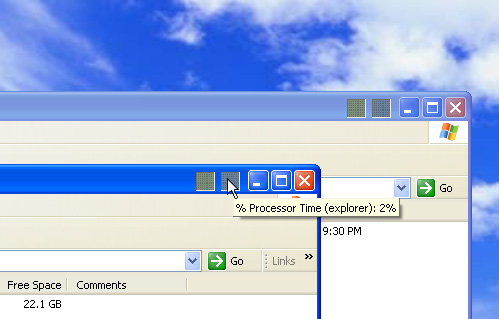 | Display process counters on the corner of each window next to the system buttons to able to see the performance easily which process of window use the system. The counters are displayed by your selections what you would like to see. Can be set the color of each performance item and you can easily get the exact value by a hint when your mouse is hovered on the performance icon of each window on your desktop. .. |
|
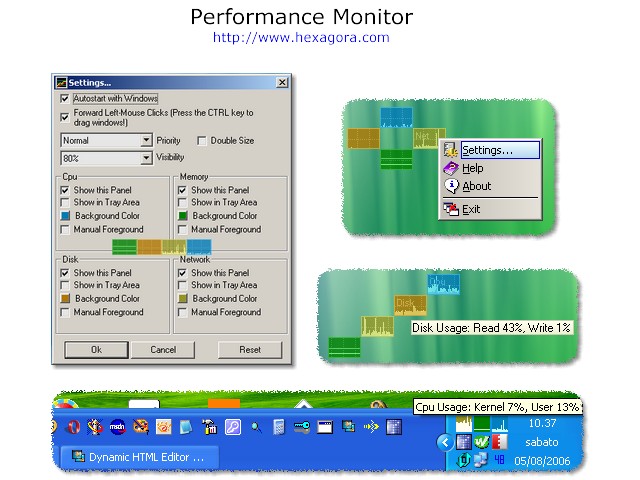 | Monitor your CPU, Memory, Disk and Network utilization with this very useful program .. |
|
Results in Keywords For performance visualization
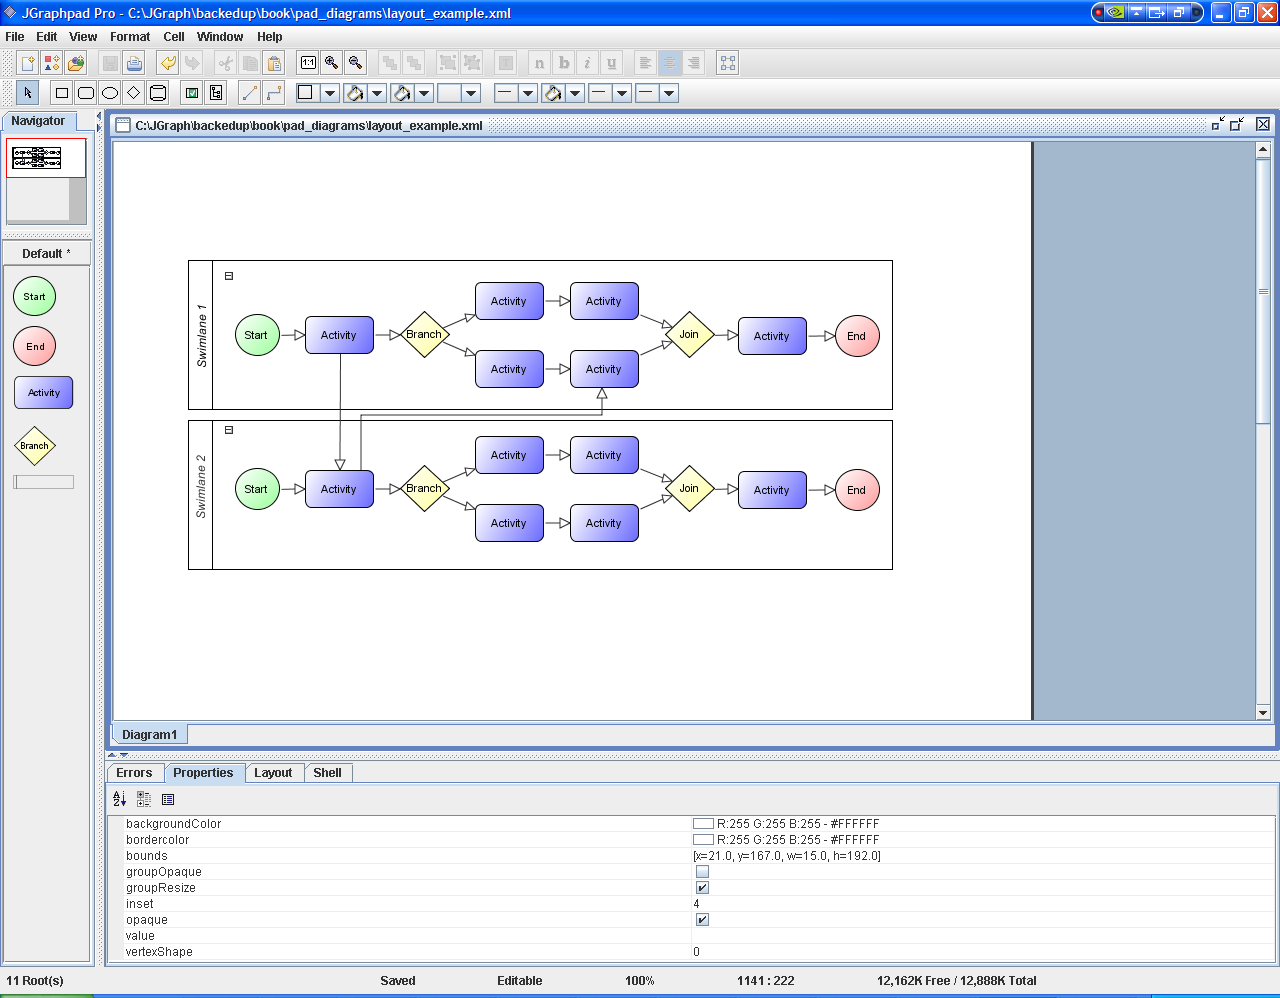 | JGraph is the leading Open Source Java Graph Visualization Library. It follows Swing design patterns to provide an API familiar to Swing programmers and functionality that provides a range of features. Graph visualization is a central requirement for applications such as workflow editors, computer and telecommunication networks display, flowcharts, VLSI and CAD, business process modeling, organizational charts, entity-relationship and cause and effect diagrams, and much more.
The core JGraph library provides all the features required in a graph visualization library. Built on top of the core are JGraph Layout Pro and JGraphpad Pro. JGraph Layout Pro provides graph layouts that automatically position your nodes. There is a hierarchical layout for workflows, tree layouts for organization charts and so on. JGraphpad Pro is a complete application framework that enables you to rapidly prototype your application, dramatically reducing your time to market for your product... |
|
| UCanCode provides a complete set of services, consisting of design tools and a software development kit (SDK), for developers who want to create a user interface for industrial monitoring and process control drawing SCADA applications...
|
|
| UCanCode BPM C++ Extension Library with 100% BPM and workflow features, build Advanced Diagrams and Dashboards for Business Process Management (BPM) in minutes.. |
|
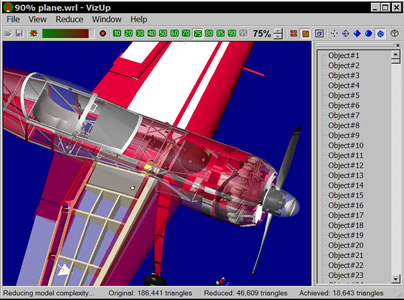 | Models that you create with the help of 3D modeling tools, as well as models converted from CAD software can be extremely complex. These models may consist of many hundreds of thousands of polygons and be practically impossible to process in real-time visualization.
VizUp Professional has the basic set of functionalities. It enables you to reduce the number of polygons in a complex 3D model while retaining the quality and appearance of the original. The end result of the reduction is a 3D model with a well-balanced level of details and size, which is perfect for the use in virtual reality and real-time visualization systems. The process of reduction is extremely simple and doesn..
|
|
| UCanCode Software Inc. is a premier provider of Dynamic Graphics, Data Visualization, Human-Machine Interface (HMI) and Real-Time Mapping Solutions for software developers around the world... |
|
 | VizUp Streamline Professional enables you to reduce the number of polygons in a complex 3D model while retaining the quality and appearance of the original. Supports Wavefront .OBJ, VRML 2.0/97 and StereoLitho (.STL) file formats...
|
|
 | Internet-ready, real-time 3D software from Bitmanagement will progressively penetrate traditional industries and consumer markets... |
|
 | Electronic paper product catalog software with page visualization and database. Uses existing catalogs in DTP or PDF on PC and/or Internet. Automatically connects article numbers on pages with database. Comes with comprehensive ordering system... |
|
 | Build your own Multisim like circuit design and simulation application!
Diagrams are a natural and intuitive way of expressing relationships in your application data. E-XD++ Components make it easy to add expressive, interactive Circuit Design.. |
|
 | Chess Vision Trainer is a chess training system to improve your visualization and move calculation skills in Chess. Visualization and calculation plays a major role in chess. These are the skills that separates the masters from the amateurs.
When Alekhine was asked "How many moves do you see ahead?" his answer was "Just one move deeper than my opponent!".
The built-in chess playing engine is your training partner. The position displayed on the chess board is not the true position but the position a certain number of half-moves prior to the true position. You do not decide the moves based on the displayed position but based on the true position (which you do not see but you're trying to visualize). This means that you are always forced to look ahead of the chess position you see on the board.
Then, there is the concept of 'Blindfold Areas'. Blindfold Areas are quadrants of the chess board and these are areas where the pieces are invisible. One of the intentions of this concept is to solve the problem of 'blind spots'. Using the concept of Blindfold Areas will also help you to develop chess board memory. This idea of dividing the chess board into quadrants for the purpose of visualization is derived from Buckley's suggestion in his book Practical Chess Analysis.
The combination of these training exercises will improve your visualization and move calculation skills... |
|
Results in Description For performance visualization
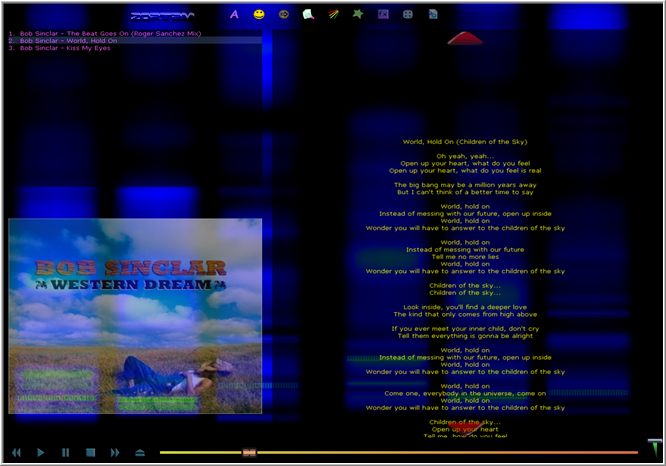 | Zortam Mp3 Player will enable you to listen all your favorite tracks and at the same time enjoy a show of lights and images visualizing the covers of your albums and song lyrics.You can add additional visualization plugins using Zortam visualization SDK .You can watch scrolling lyrics and cover arts together with different visualizations or static jpg backgrounds while playing Mp3's. Player also support switching to full sreen graphic mode.You may add your own backgrounds and plugins... |
|
| JGraph is the leading Open Source Java Graph Visualization Library. It follows Swing design patterns to provide an API familiar to Swing programmers and functionality that provides a range of features. Graph visualization is a central requirement for applications such as workflow editors, computer and telecommunication networks display, flowcharts, VLSI and CAD, business process modeling, organizational charts, entity-relationship and cause and effect diagrams, and much more.
The core JGraph library provides all the features required in a graph visualization library. Built on top of the core are JGraph Layout Pro and JGraphpad Pro. JGraph Layout Pro provides graph layouts that automatically position your nodes. There is a hierarchical layout for workflows, tree layouts for organization charts and so on. JGraphpad Pro is a complete application framework that enables you to rapidly prototype your application, dramatically reducing your time to market for your product...
|
|
| Chess Vision Trainer is a chess training system to improve your visualization and move calculation skills in Chess. Visualization and calculation plays a major role in chess. These are the skills that separates the masters from the amateurs.
When Alekhine was asked "How many moves do you see ahead?" his answer was "Just one move deeper than my opponent!".
The built-in chess playing engine is your training partner. The position displayed on the chess board is not the true position but the position a certain number of half-moves prior to the true position. You do not decide the moves based on the displayed position but based on the true position (which you do not see but you're trying to visualize). This means that you are always forced to look ahead of the chess position you see on the board.
Then, there is the concept of 'Blindfold Areas'. Blindfold Areas are quadrants of the chess board and these are areas where the pieces are invisible. One of the intentions of this concept is to solve the problem of 'blind spots'. Using the concept of Blindfold Areas will also help you to develop chess board memory. This idea of dividing the chess board into quadrants for the purpose of visualization is derived from Buckley's suggestion in his book Practical Chess Analysis.
The combination of these training exercises will improve your visualization and move calculation skills... |
|
 | Software tools that measure and strengthen personal cognitive performance. SW includes games which challenge a specific mental acuity. Know your abilities, develop your performance capabilities. Mans performance mentality is his career...
|
|
 | Zen Cart Performance module greatly increases performance of your Zen Cart-based store. How much speed do you get - some examples: Large store with 12 000 products and 1279 categories. Before performance optimization: 4.33 sec. After performance optimization: 0.64 sec = 676% increase! Medium-size store with 800 products and 23 categories. Before performance optimization: 2.23 sec. After performance optimization: 0.41 sec = 212.38% increase!.. |
|
| Models that you create with the help of 3D modeling tools, as well as models converted from CAD software can be extremely complex. These models may consist of many hundreds of thousands of polygons and be practically impossible to process in real-time visualization.
VizUp Professional has the basic set of functionalities. It enables you to reduce the number of polygons in a complex 3D model while retaining the quality and appearance of the original. The end result of the reduction is a 3D model with a well-balanced level of details and size, which is perfect for the use in virtual reality and real-time visualization systems. The process of reduction is extremely simple and doesn..
|
|
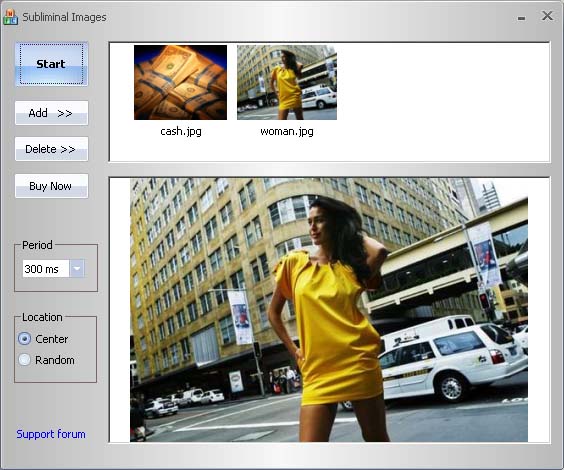 | Dream Board is a program for visualization (do you remember "The Secret"?). This program helps you to create subliminal dream boards. You can add any graphic files to it to start visualization. Exposure time of each image is extremely low, the effect is called subliminal messaging, and images are being imprinted into your subconscious mind, making it believe in your dream and therefore the Law of Attraction starts working making positive changes in your life. You can attract money, carrier, love, charisma, health, self-confidence and much more. Visualisation is a really powerful technique and computer helps you maximize the power of your vision board. To find more information about the Dream Board program and about the law of attraction, visit our home page at http://www.preduprejdaet.com.. |
|
 | osCommerce Performance module greatly increases performance of your osCommerce-based store.
How much speed do you get - some examples:
... Large store with 12 000 products and 1279 categories.
Before performance optimization: 4.33 sec.
After performance optimization: 0.64 sec.
676% increase
... Medium-size store with 800 products and 23 categories.
Before performance optimization: 2.23 sec.
After performance optimization: 0.41 sec.
212.38% increase.. |
|
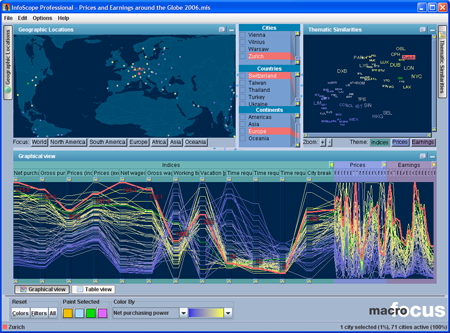 | InfoScope is an interactive visualization tool to access, explore, and communicate large or complex datasets... |
|
| WiseCleaner is the ultimate registry and system cleaning tool and performance improvement machine! With WiseCleaner, you can now safely reduce the size of your system registry, optimize it for better performance, therefore improving performance!.. |
|
Results in Tags For performance visualization
| Internet-ready, real-time 3D software from Bitmanagement will progressively penetrate traditional industries and consumer markets... |
|
| VizUp Streamline Professional enables you to reduce the number of polygons in a complex 3D model while retaining the quality and appearance of the original. Supports Wavefront .OBJ, VRML 2.0/97 and StereoLitho (.STL) file formats...
|
|
| Models that you create with the help of 3D modeling tools, as well as models converted from CAD software can be extremely complex. These models may consist of many hundreds of thousands of polygons and be practically impossible to process in real-time visualization.
VizUp Professional has the basic set of functionalities. It enables you to reduce the number of polygons in a complex 3D model while retaining the quality and appearance of the original. The end result of the reduction is a 3D model with a well-balanced level of details and size, which is perfect for the use in virtual reality and real-time visualization systems. The process of reduction is extremely simple and doesn.. |
|
| JGraph is the leading Open Source Java Graph Visualization Library. It follows Swing design patterns to provide an API familiar to Swing programmers and functionality that provides a range of features. Graph visualization is a central requirement for applications such as workflow editors, computer and telecommunication networks display, flowcharts, VLSI and CAD, business process modeling, organizational charts, entity-relationship and cause and effect diagrams, and much more.
The core JGraph library provides all the features required in a graph visualization library. Built on top of the core are JGraph Layout Pro and JGraphpad Pro. JGraph Layout Pro provides graph layouts that automatically position your nodes. There is a hierarchical layout for workflows, tree layouts for organization charts and so on. JGraphpad Pro is a complete application framework that enables you to rapidly prototype your application, dramatically reducing your time to market for your product...
|
|
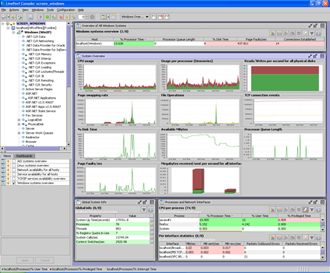 | LivePerf is a customizable performance monitoring tool for servers and distributed systems, featuring: * Consistent view across vendors, operating systems and application versions. * Extracting and presenting custom data, extracted from SQL queries, Java applications and even command line tools. Also allows defining own statistics and displaying them in custom charts and tables. * Record monitoring sessions and analyse them later... |
|
| The Disk Performance Analyser for Networks is a stand-alone utility that detects and reports fragmentation-related performance loss on networked systems. It provides this never before available, easy to use functionality all from a single location...
|
|
| InfoScope is an interactive visualization tool to access, explore, and communicate large or complex datasets... |
|
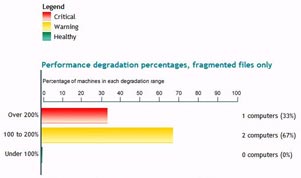 | Disk Performance Analyzer for Networks (DPAN) is a free tool allowing you to monitor fragmentation across a network quickly and easily... |
|
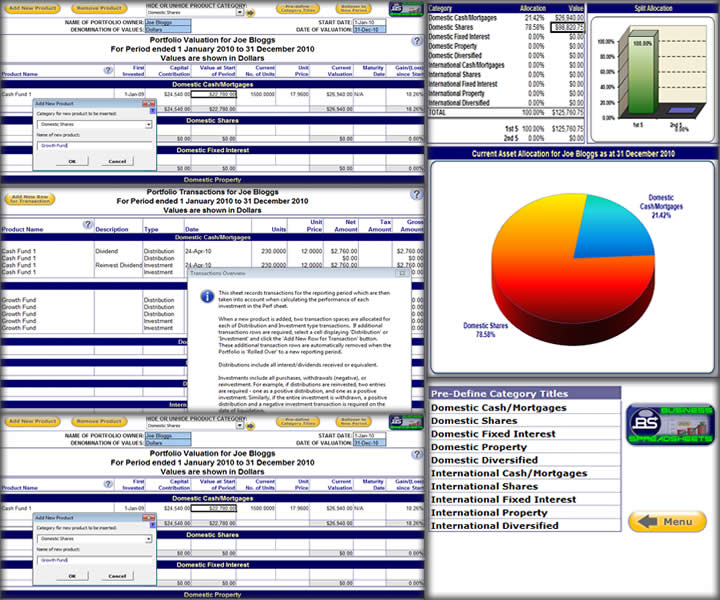 | The Portfolio Performance Monitoring model enables the ongoing monitoring and periodic valuation of a portfolio of financial investments. Amount and timing of investment and divestment transactions are taken into account in performance calculations... |
|
| Performance Pinging, Perfping.exe
Version 2.0.0; March 2006
How does it work and what does it do?
Perfping is a tool that allows you to ping a host continuously or with a single
ping using different data volumes. This can give you an indication of the
performance of the route to your host. You can change the ping interval from 2
to 30 seconds using various timeouts. The timeout is always smaller than the pinging
interval. Results are written to log window and log file if so chosen.
Unreachable hosts have a value of 0 ms.
The analysis function sends various pings, 10 each of 10 bytes, 100 bytes, 500
bytes, 1 kbytes, 10 kbytes, 50 kybytes and 64 kbytes. The round trip times are
shown with the total and average times.
Comments:
- Errors are written to file and log window but may be shown later than
successfull pings when changing ping intervall and timeout during runtime
- Thanks to Francois Piette for the internet component suite, Angus Robertson
for the threaded version of Ping and Dr. Jurgen Kehrel for the graph component... |
|
Related search : ime visualizationreal time,real time visualizationtime visualization systemsvizup streamline professionalvizup professionaltime visualizationreal time,real time visualizationtime visualization systemsgraph visualization,graph visualization library,peOrder by Related
- New Release
- Rate
network visualization -
graphic visualization -
storage visualization -
visualization program -
g_force visualization -
|
|